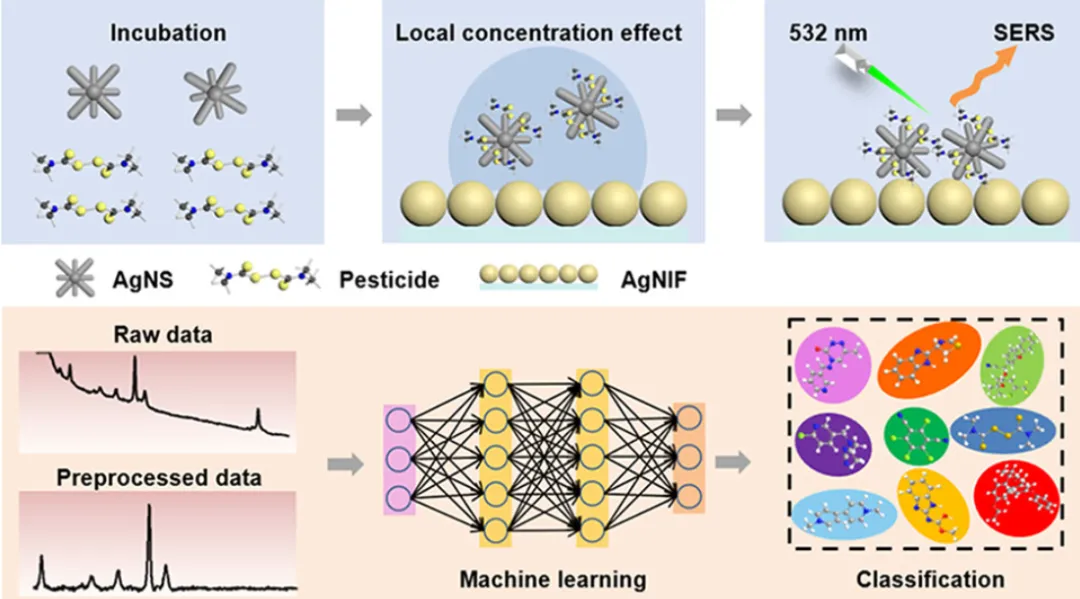
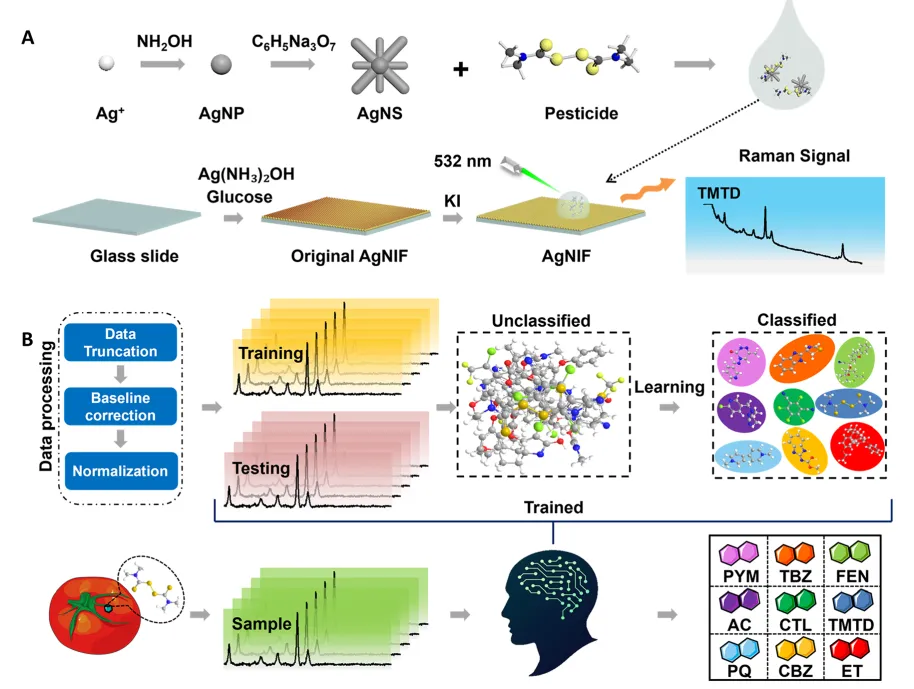
Scheme 1. Schematic of the CNN-Assisted SERS Platform for Sensitive and Accurate Detection of Multiple Pesticides
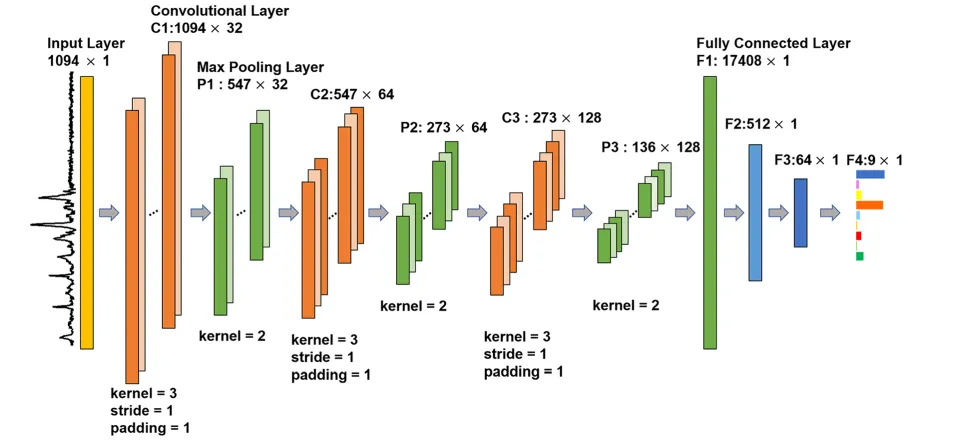
Scheme 2. CNN Architecture for Pesticide Classification, Comprising Three Convolutional, Three Max-Pooling, and Four Fully Connected Layers
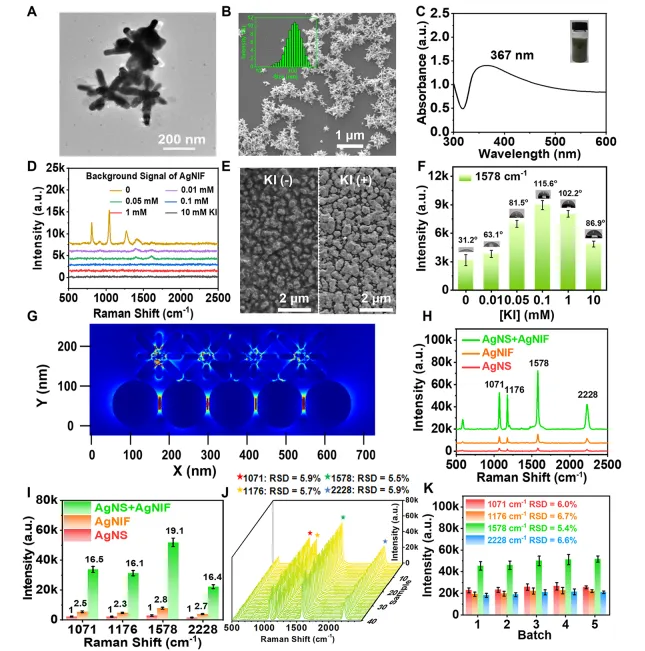
Figure 1. Characterization and performance of the AgNS/AgNIF SERS platform. (A) TEM and (B) SEM images (inset: size distribution) of AgNS. (C) UV-vis spectrum of AgNS. (D) Background signal of KI-treated AgNIF. (E) SEM images of AgNIF before and after KI treatment. (F) SERS intensity of 4-MBN at 1578 cm-1 and water contact angle (inset) on KI-treated AgNIF. (G) FDTD simulation of the hybrid platform. (H) SERS spectra and (I) peak intensity comparison of 4-MBN on different substrates. (J, K) RSD values from (J) 40 random points and (K) fivebatches of the hybrid platform.
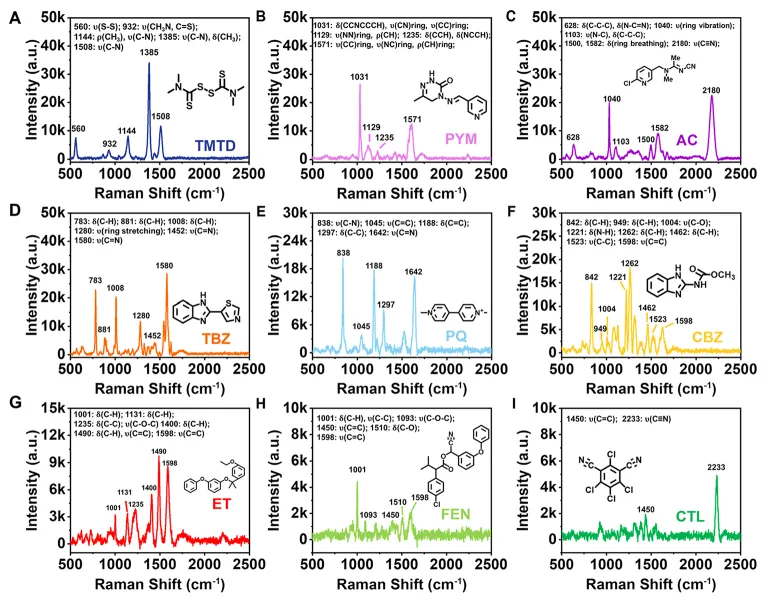
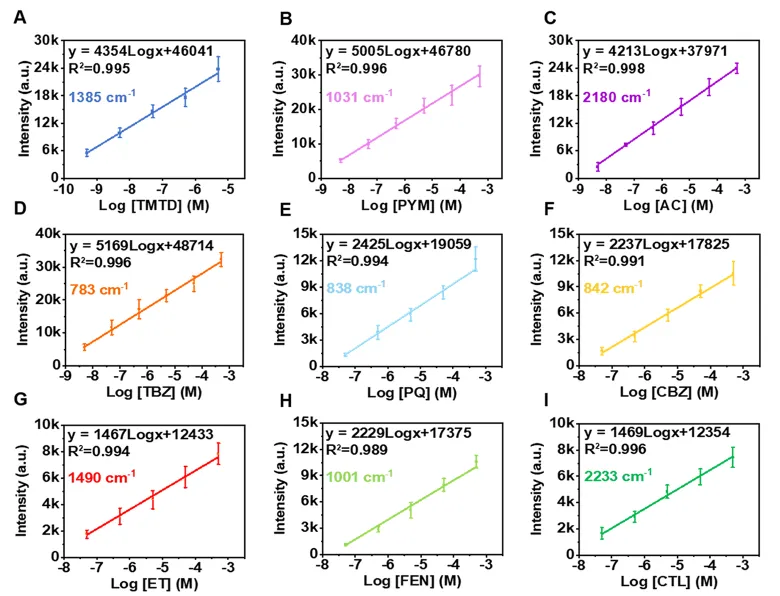
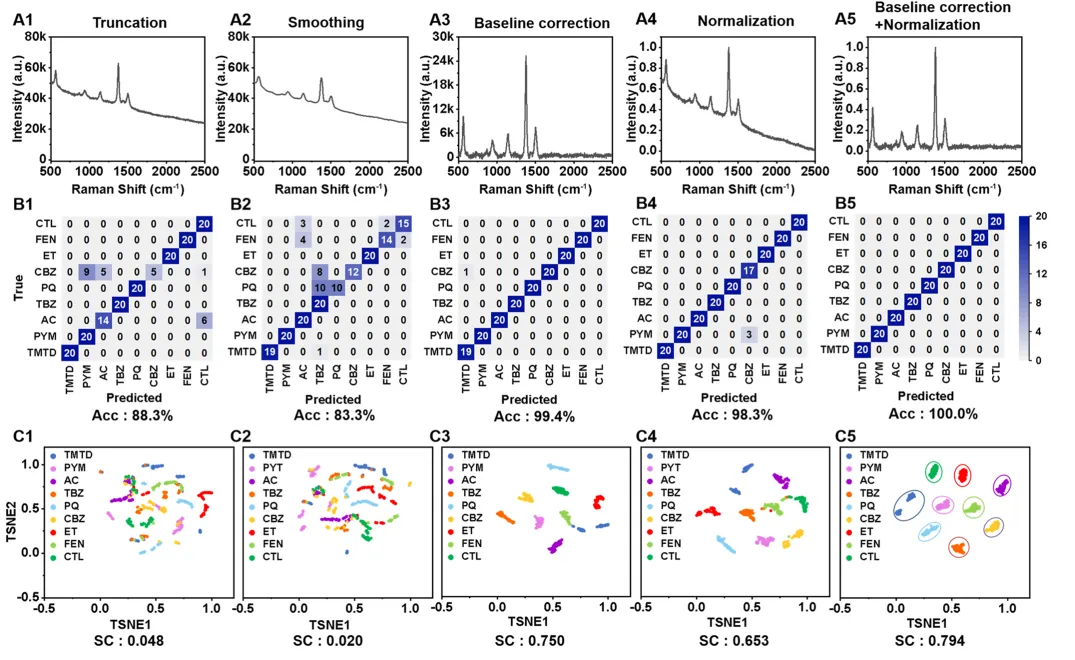
Figure 2. Representative SERS spectra and characteristic peak assignments of (A) TMTD, (B) PYM, (C) AC, (D) TBZ, (E) PQ, (F) CBZ, (G) ET, (H) FEN, and (I) CTL.Figure 3. Standard curves for the nine pesticides were established by plotting the intensity of a characteristic SERS peak against concentration. Error bars indicate the standard deviation from three replicate measurements.Figure 4. Pesticide identification using classification algorithms with different data preprocessing protocols. (A) Representative SERS spectra under different data processing patterns. The identification results of (B) the CNN model and (C) the TSNE cluster analysis. Data preprocessing protocols: (A1-C1) truncation, (A2-C2) smoothing, (A3-C3) baseline correction, (A4-C4) normalization, and (A5-C5) baseline correction + normalization.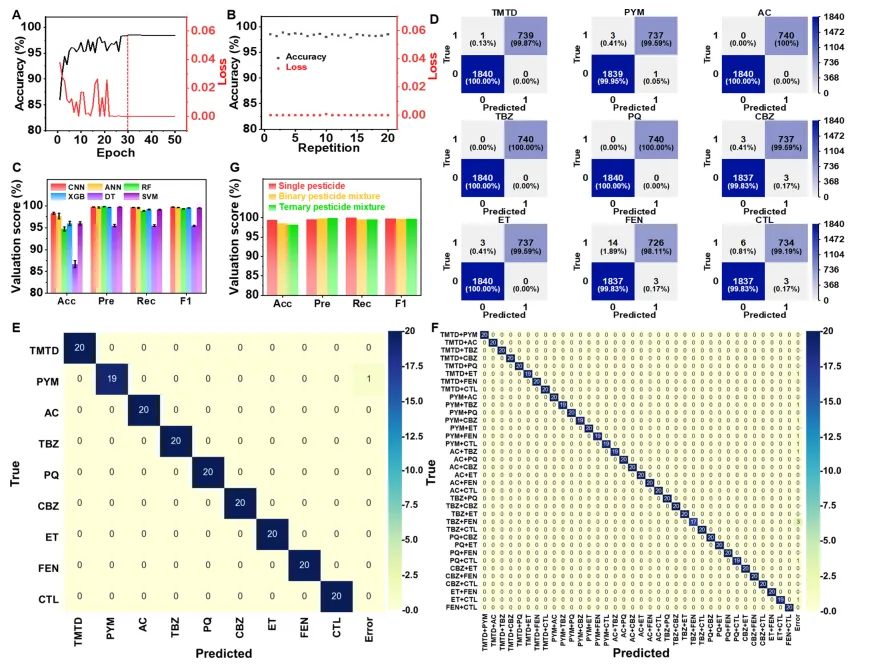 Figure 5. CNN-based classification of single pesticides and their mixtures. (A) Evolution of test loss and accuracy across training epochs. (B) Distribution of loss and accuracy from 20 random training-test splits. (C) Comparison of key classification metrics (accuracy, precision, recall, F1 score) among different classification algorithms. (D) Confusion matrix for identifying each pesticide type across 2580 SERS spectra. (E, F) Confusion matrices for (E) single and (F) binary mixture identification. (G) Assessment of CNN performance in predicting single pesticides, binary mixtures and ternary mixtures.
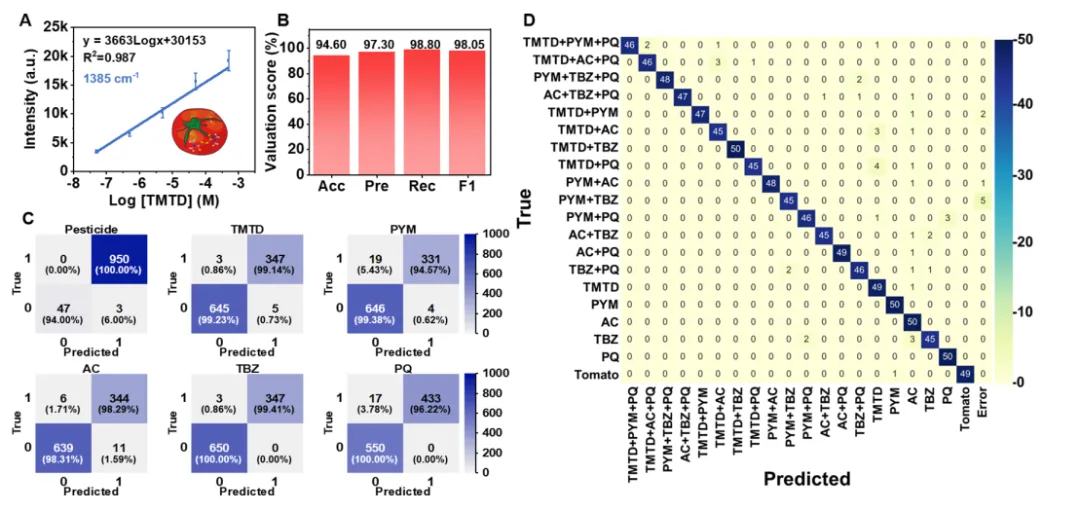 Figure 6. Pesticide detection in tomato samples using the CNN-assisted SERS platform. (A) Concentration-dependent response of TMTD in tomato juice, quantified at 1385 cm-1. The error bars represent the standard deviation of three replicate measurements. (B) Identification performance metrics for each pesticide in tomatoes. (C) Confusion matrix for identifying each pesticide type in tomato juice across 1000 spectra. (D) Confusion matrix for the identification of five single pesticides and their binary/ternary mixtures in tomatoes.


 10个月宝宝每天需要喝多少奶粉?
